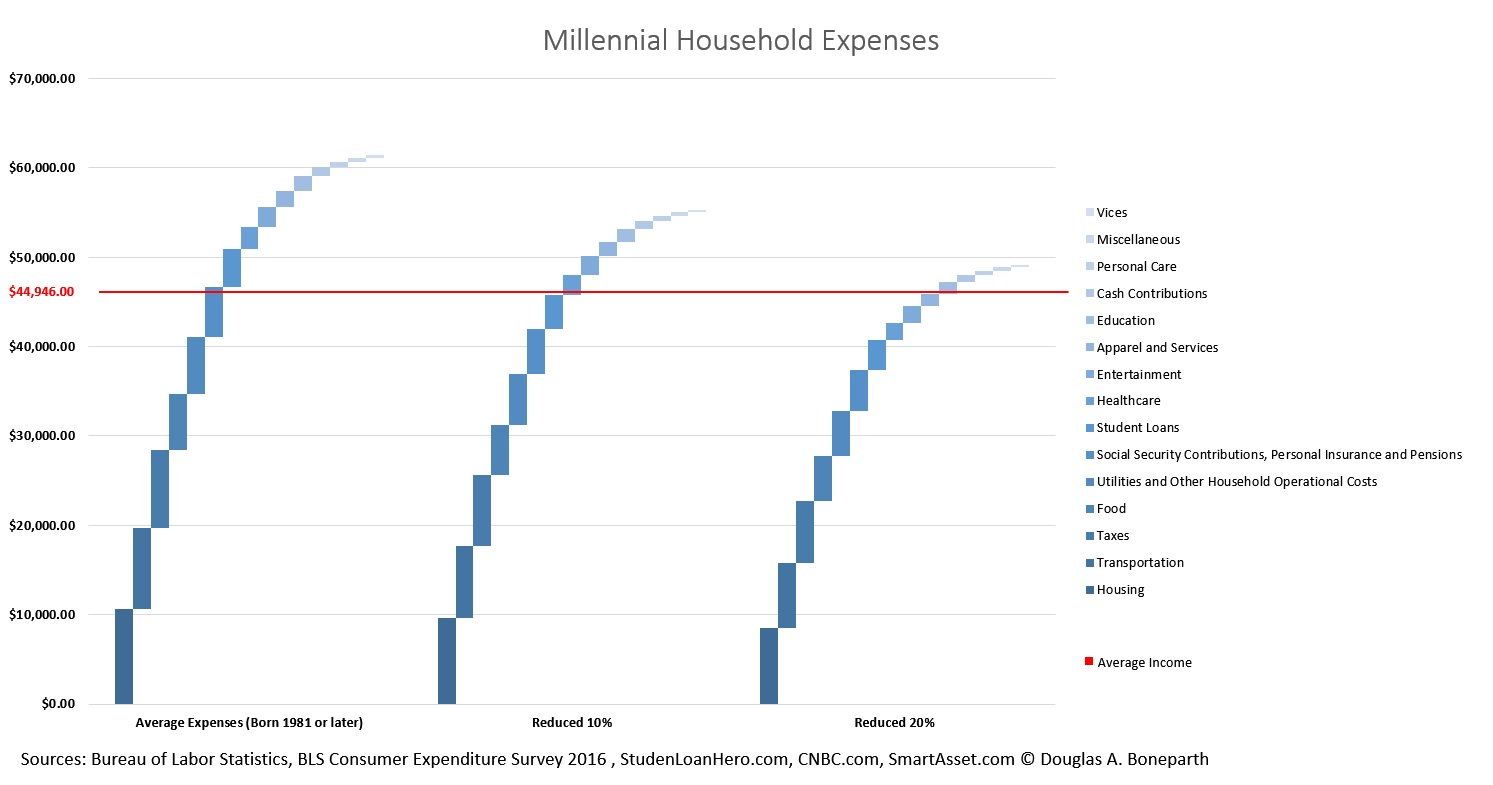
 What you are looking is the total annual living expense for those born in 1981 or later (aka Millennials) using generational data from the Bureau of Labor Statistics’ Consumer Expenditure Survey. I added the average monthly student loan added for borrowers between the ages of 20 to 30, which I added from StudenLoanHero.com (and was oddly missing from the CES data). I then adjusted that expense data down by 10% and 20% respectively to account for conservatism or those living a more “frugal life”.
The same 2016 CES data that I used for the house expenses states that the average pre-tax income for those born 1981 or later is $65,373. However, I wanted to acknowledge that mean income stats appear to vary greatly within the Millennial demographic (and by source). For example, SmartAsset.com, using similar 2015 BLS data, shows mean a salary of $35,592 for those were between 16 and 34. It’s also worth pointing out a general flaw I believe exists when using data across the entire Millennial demographic, which is that younger Millennials (typically aged 18 to 26) tend to obscure the data. Meaning there’s a too large a difference between the financial life of a 22-year-old and that of a 32-year-old, particularly from an income standpoint.
For those who prefer using median income, I researched this as well. It is also “all over the place” depending on the source and who’s manipulating the data, but let’s go with CNBC’s reporting, which also used published BLS data (this time from Q2 2017). They state that those between the ages of 20 to 24 earn a median income of $27,300/annually while those 25 to 34 earn a median income of $40,452/annually. The average of these two incomes is $33,873, and the average of all mean above is $44,946/annually, which is plotted as the red line on the chart.
Summary:
I ran this exercise for a few reasons. The first was to see how student loan payments looked as part of the overall household expense stack. Loans are the 7th largest expense overall and, I’d argue, is a meaningful “absorber” of potential savings (keep in mind that it is a singular expense while some larger categories are bundled).
The second reason was to look at this data in the context of income to see how stagnant wage growth plays a role in making savings difficult for Millennials. Clearly, with median income being pretty much unchanged among 25 to 35 year-olds over the last 40 years, one might conclude that this is the more significant headwind for Millennials than increased expenses when it comes to savings. Bottom line is that expenses have increased while incomes never did. What is most surprising is that, regardless of which expense stack you use, expenses are greater than income, suggesting that, on average, Millennials are living beyond their means and, perhaps, taking on additional debt to cover the shortfall.
Overall, I wanted to use this chart to make a point about “rules of thumb”, specifically with regards to how much people should be saving towards their goals (i.e. 10% of your income should be allocated towards retirement savings). Based on the chart, my claim is that most of these rules are simply out of touch with the financial realities of the Millennial generation and, at worst, place guilt on a demographic that might have greater financial challenges and concerns than socking money away for long-term financial goals (or just about any goal for that matter). Hey, maybe these “rules” are being thrown in our faces again and again to keep the money piling into the coffers of investment managers, plan administrators and asset management companies? I digress. I think, again, I hast more has with that lack of understanding regarding Millennials.